ENERGY STAR Update 2018

The ENERGY STAR score places a number on how your building measures against peers in your location. Prior to August 26th, 2018, the peer building data came from the 2003 Commercial Building Energy Certification Survey (CBECS) — that’s more than 16 years old!
This August, the EPA updated the dataset and models in Portfolio Manager with data from CBECS 2012. With the technological improvements in the construction industry, the average energy performance of all building types has improved in the last decade. As a result, the ENERGY STAR score, which compares your building with its peers, is likely to decrease.
What is the ENERGY STAR Score and which buildings are eligible to get this score?
The objective of the ENERGY STAR Score is to provide an assessment of the energy performance of a property relative to its peers. The score considers the climate, area, and business activities of the property. The score provides a percentile ranking of performance from 1-100 through statistical analysis of the energy utility data of the peer building population and the actual energy usage of your building. A score of 50 represents median energy performance, while a score of 75 means your building is a top energy performer. ENERGY STAR score is currently available for more than 80 property types built into Portfolio Manager.
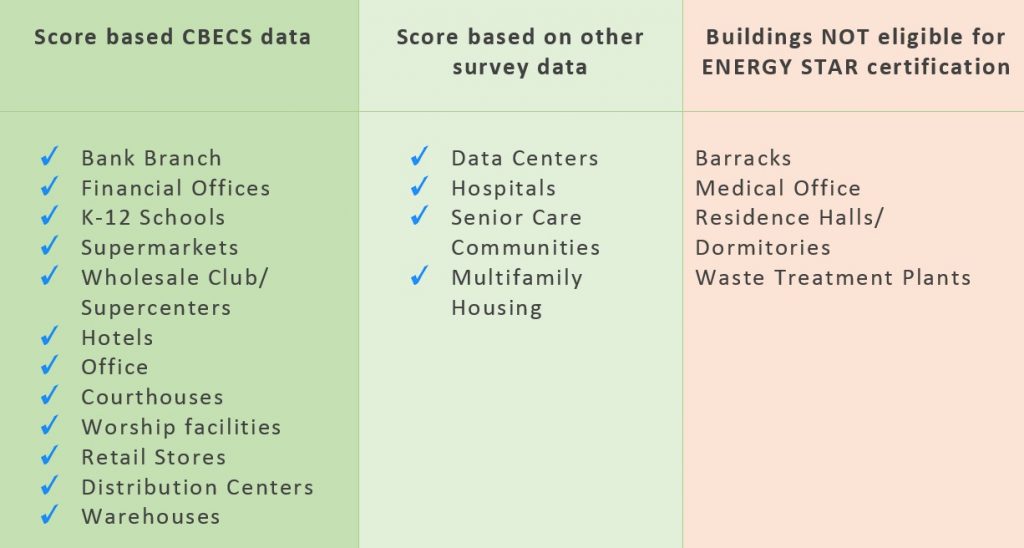
What are the eligibility criteria for ENERGY STAR certification?
Most buildings are able to earn ENERGY STAR certification. Those not eligible include medical offices, barracks, and residence halls. A building must earn an ENERGY STAR score of 75 or higher to receive ENERGY STAR certification. This indicates the building performs better than at least 75% of similar structures nationwide.
How is the peer building data generated?
The Commercial Buildings Energy Consumption Survey (CBECS) provides data supporting the analysis of most commercial building types. The United States Department of Energy’s Energy Information Administration (EIA) conducts the survey approximately every four years. The next CBECS is on the schedule for this year, and an ENERGY STAR update will occur in 2023 or 2024.
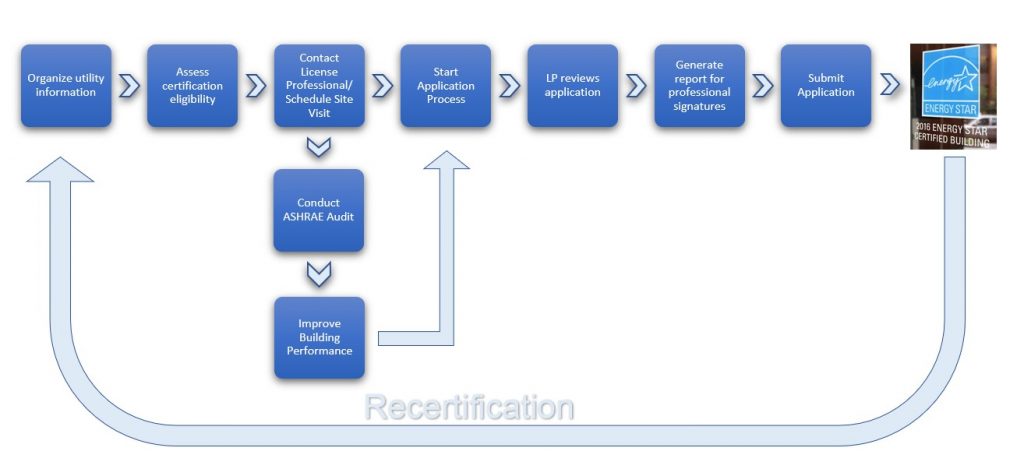
What is the process to pursue ENERGY STAR Certification?
Certification occurs annually. Therefore, a building must maintain high performance to achieve annual certification. Prior to approval, a licensed Professional Engineer (PE) or Registered Architect (RA) must verify the accuracy of the application information. How to Apply for ENERGY STAR Certification provides additional information regarding the process.
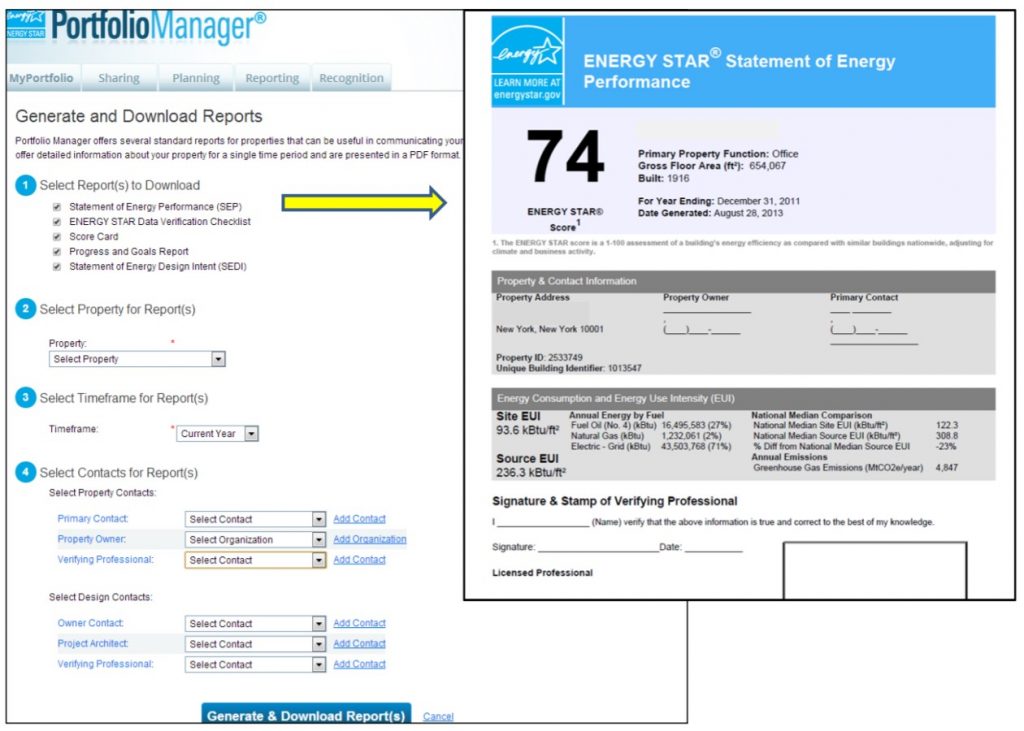
What is the ENERGY STAR Portfolio Manager?
The ENERGY STAR Portfolio Manager is the EPA’s online energy management tool that enables projects to measure and track the energy and water performance of any building over time. Online applications for ENERGY STAR certifications are submitted via Portfolio Manager. To get started, basic building information, as well as utility bills, must be provided. Typically, this involves manual entry. However, there are software products and other services available that utilize use a process called web services to “exchange data” between utility and Portfolio Manager.
What was updated on August 26th, 2018?
As of August 26th, 2018, the EPA updated the dataset and models in Portfolio Manager that form the basis of the ENERGY STAR score with data from CBECS 2012. There is generally a time lag between when the data is collected and published because of the validation and aggregation that is required before the data becomes available. For instance, the CBECS 2012 data became available in 2016 so the new ENERGY STAR score criteria come from the results of the 2012 survey.
Note: The EIA was unable to publish the 2007 CBECS due to some errors in the data; therefore, prior to this update, many of the scores continued to rely on data collected in 2003.
The changes from this update will affect the 1-100 ENERGY STAR score models for U.S. buildings (based on CBECS 2012):
- Offices – Financial, Bank branches
- Courthouses
- Retail Store
- Warehouses/Supercenter
- Supermarkets
- Hotels
- Houses of Worship
- K-12 schools
For the following building types, additional information is now required that may affect the score.
- For K-12 schools, the “Number of Workers on Main Shift” is now required to calculate the 1-100 score. Previously, this was an optional field, and if left blank, a default value was assumed based on each school’s gross floor area. The number of Computers and Walk-in Refrigerator/Freezer Units in schools are no longer required and will not contribute to the score.
- For offices, percent of area heated is no longer required and will not contribute to the score.
- For warehouses, the percentage of gross floor area used for cold storage, the percent that can be cooled, and the percent that can be heated is now required.
- For worship facilities, the gross floor area used for food preparation, the percent that can be cooled, and the percent that can be heated, is now required.
- Supermarkets now require the number of open or closed refrigeration/freezer units
- For data center benchmarking, it is now required to measure the IT energy. Portfolio Manager is now able to estimate the energy use for small data centers within projects and estimates can be applied to a maximum of 10% of your property’s total gross floor area.
- The new building size minimum to be eligible for ENERGY STAR score has been revised from 5,000 square feet for offices, schools, and warehouses to 1,000 square feet.
- The national source energy factor was revised based on electricity generated by renewable sources. In the past, this was treated as requiring the same raw fuel input as fossil fuel energy. With the updates, offsite renewables lower the national average electric source factor. The source factor drops from 3.1 to 2.8. The ENERGY STAR score could increase or decrease depending on a building’s fuel-mix ratio. Additionally, U.S. national, site/source medians, average fuel costs, weather stations, and GHG emission factors have also been revised. You can use the EPA’s power profiler to compare your property’s fuel mix with the national mix HERE.
Our building has an ENERGY STAR score of 80, how will the recent update affect my score?
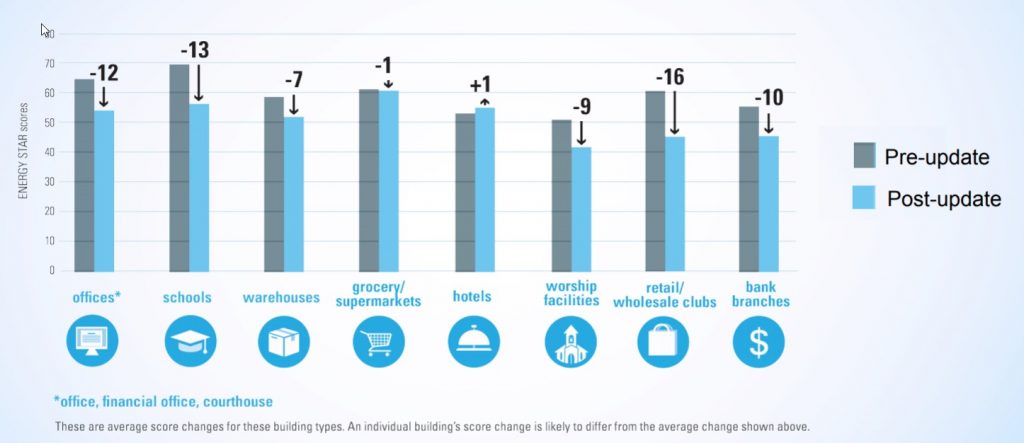
As average energy and grid performance improves, the ENERGY STAR scores and performance metrics of individual buildings, on average, decrease. From 2003 to 2012, there were significant changes in the United States building stock, to which your building is compared.
The chart below provides the average ENERGY STAR score change by space type. If the score of a project has reduced more than these averages, it’s probably because the analysis of expected score changes did not include mixed-use buildings, due to the complexity of calculating their expected score changes. Buildings may differ from the typical building in the chart below.
One of our recent ENERGY STAR applications for an office building in Atlanta received a score of 95. If submitted post-update, it would have received a score of 90. In Florida, an office building would drop 10 points, from 93 to 83. Thus, we can infer that the change in your building’s ENERGY STAR score will vary from the published average depending on energy use, fuel mix, business activity, property type, and other variables.
Why did my 1-100 score change even though my property type wasn’t included in the 2012 CBECS update? (Hospitals, Multifamily, etc.)
Since the source energy information was updated, it is likely to affect all building types.
- Electricity site-to-source conversion factor dropped from 3.1 to 2.8, which will impact all properties that use electricity. This update reflects improvements to the electric grid’s efficiency.
- District chilled water site-to-source conversion factor dropped from 1.00 to 0.91
We manage a building/portfolio of buildings that would like to pursue ENERGY STAR certification. How can Newcomb & Boyd help?
Newcomb & Boyd has experience helping numerous projects achieve ENERGY STAR certification. Our licensed engineers can help you navigate the process. For projects that do not meet the eligibility criteria, we work with owners and facility staff to improve the building energy performance.
Our talented and committed engineers provide commissioning services during the design process to ensure that the building operates efficiently. Our retrocommissioning scope comprises not only improving building performance but also empowering the facility staff with tools and training, to ensure ongoing success long after we are gone.
We also provide design services to replace equipment or implement advanced control systems, analytics, and dashboards. Each project offers unique opportunities for us to tailor a solution that meets your requirements and goals.
Is ENERGY STAR score available for projects in the schematic or design phase? How can Newcomb & Boyd help?
Yes, energy modeling results help to provide an ENERGY STAR score during the design phase. Our Energy and Sustainability group will work with you to create energy and water goals from the project requirements and to provide real solutions to design a high performing, healthy building.
The Target Finder Score tool is used by design projects to estimate the ENERGY STAR score. The tool correlates the estimated energy consumption with a corresponding ENERGY STAR score in the design stages. Since both Portfolio Manager and Target Finder calculate the scores using the same underlying data and methods, the design metrics also got an update in August 2018.
A technical reference document provides the national median averages for different project types. The national median source energy unit intensity (EUI) is a recommended benchmark metric for all buildings. The median value is the middle of the national population – half of the buildings use more energy, half use less. The median EUI (kBTU/sqft/yr) for your specific project may vary based on the project location, number of occupants, and space type mix.
If this information has been helpful, please leave comments or questions below. Reach out to us if you would like us to help you get on the path to ENERGY STAR certification.
References
References and image source: https://www.energystar.gov/