


Smart Solutions
Transforming A Campus Wellness Center into a Digital Destination through Integrated AV Design
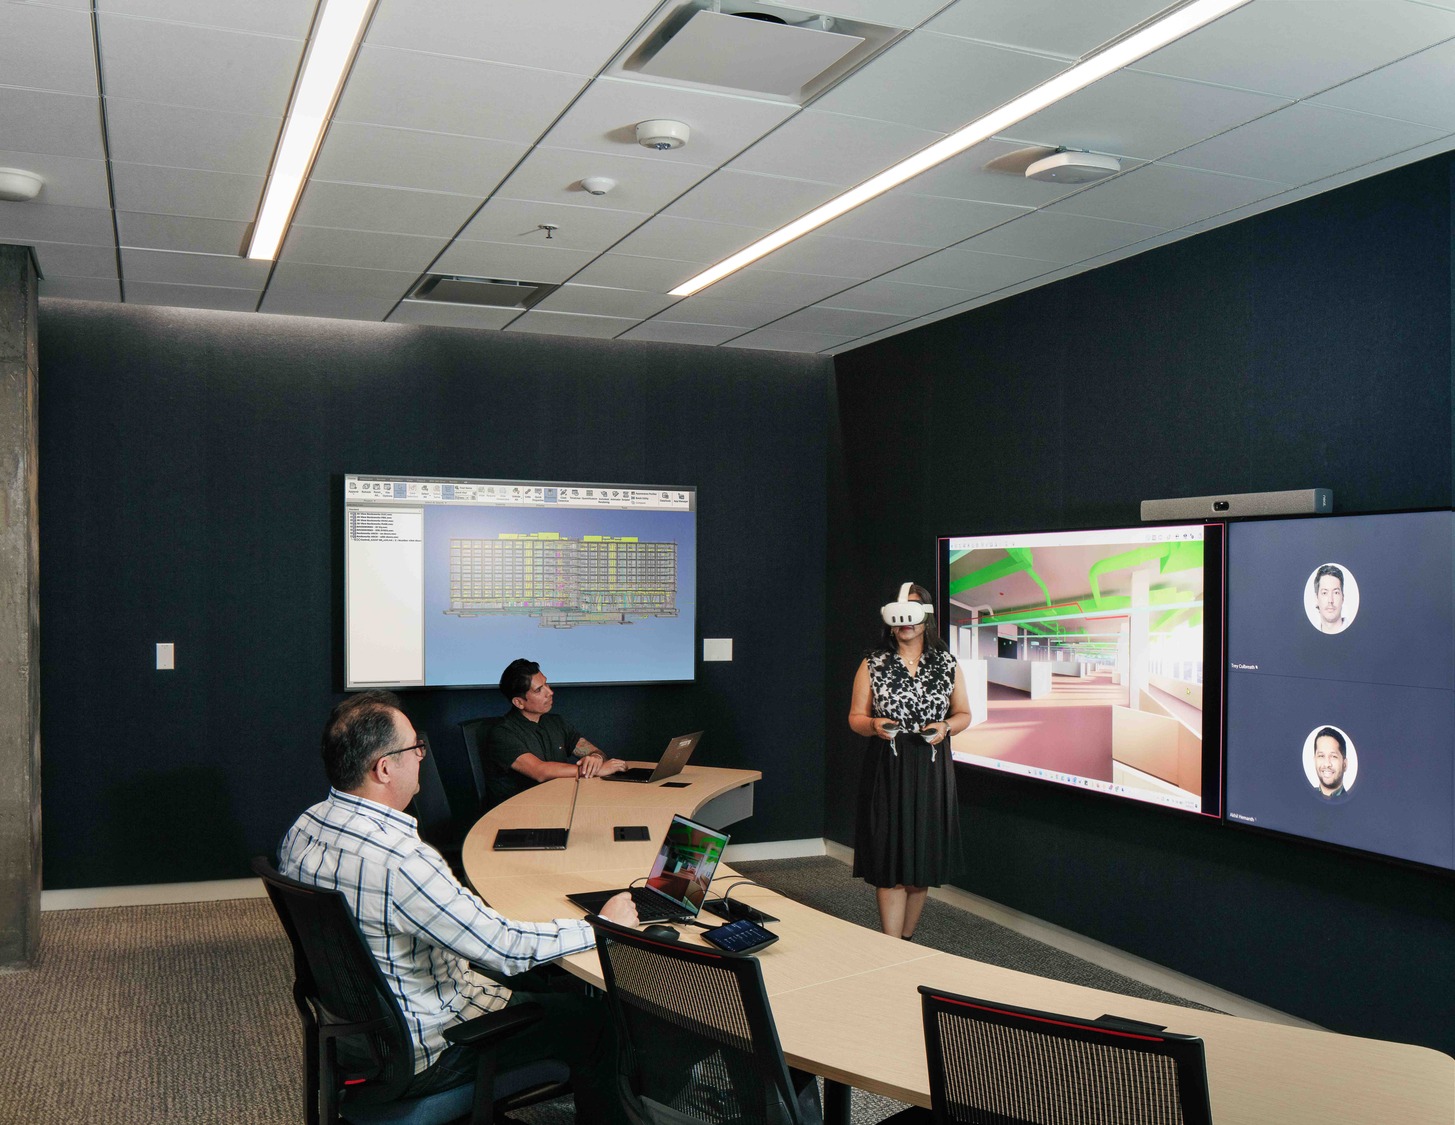
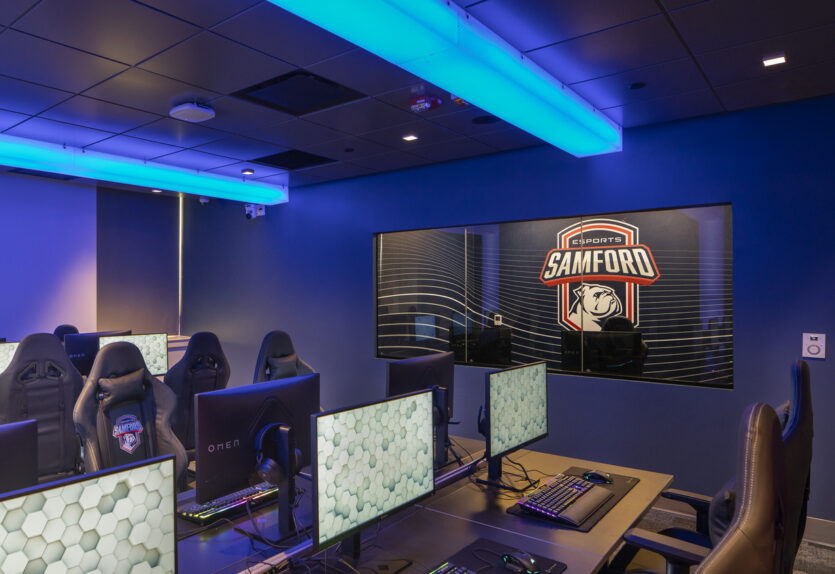
Samford University’s Seibert Wellness Center has reopened as one of the most dynamic and technologically advanced facilities on campus, where wellness, competition, and connection come together. Our team helped Samford create a future-ready environment that integrates wellness, academics, and digital innovation.
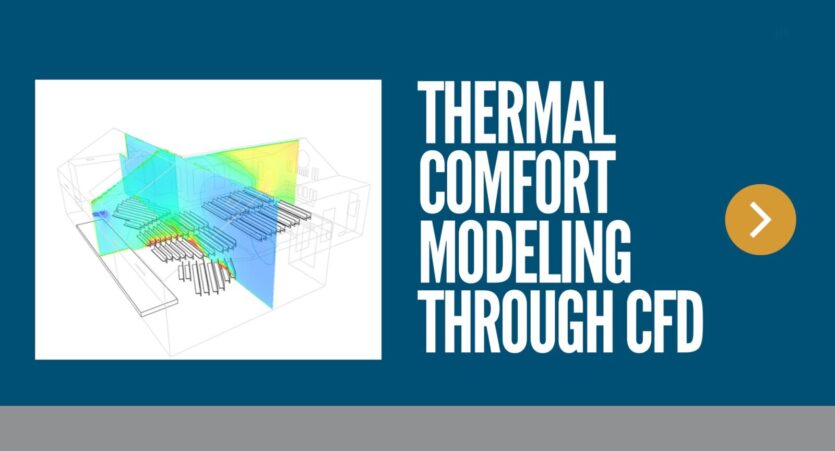
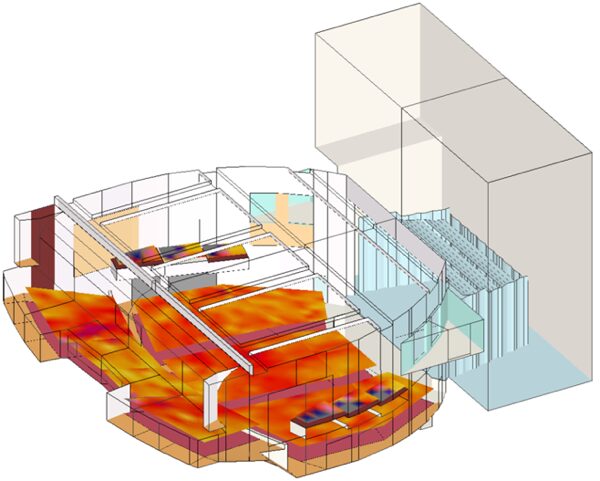
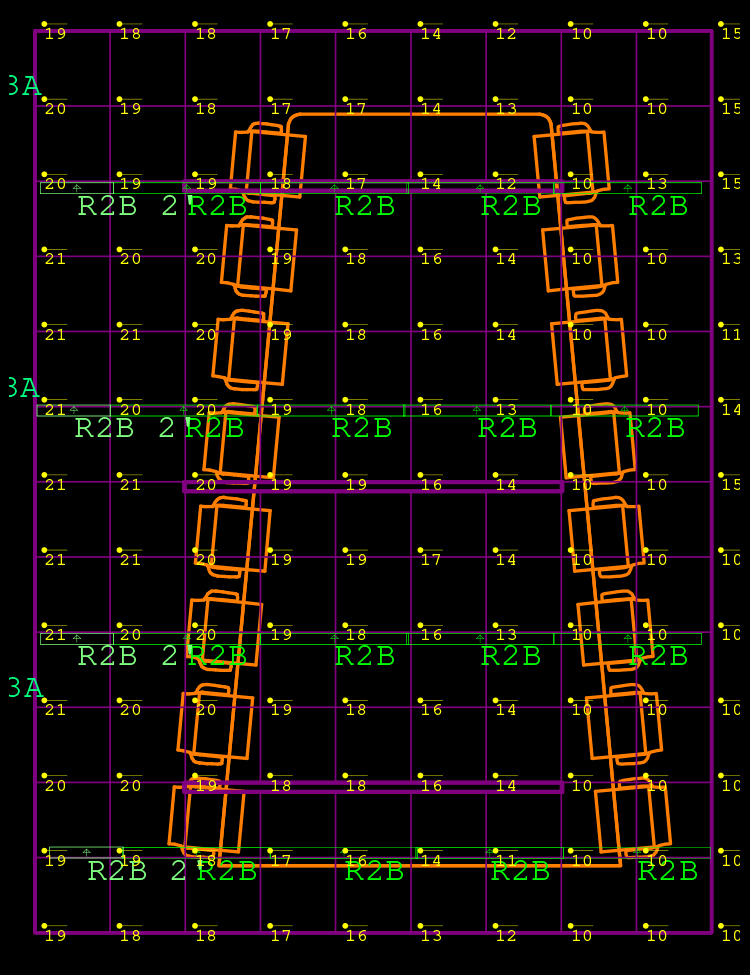
Using CFD to Redefine Comfort in Historic Auditoriums
By simulating real-world conditions, we turned complex HVAC choices into confident design decisions.
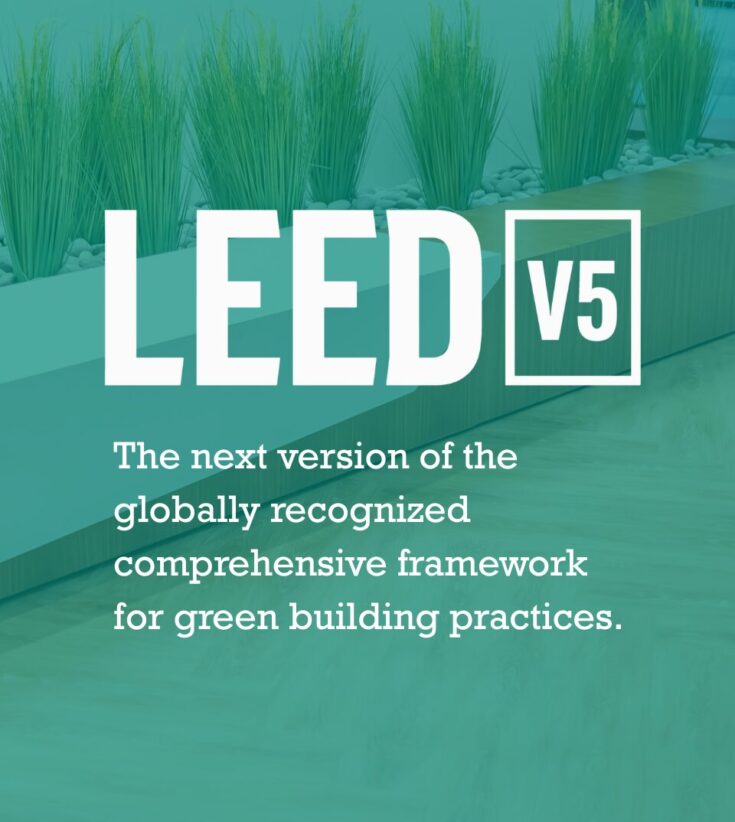
Building Smarter Futures: How Our Team is Influencing LEED v5
At Newcomb & Boyd, our Sustainability Studio staff are recognized experts who not only help clients achieve their goals every day, but also advance sustainability across the industry.
Leveraging Data to Drive Sustainability
Is your data hindering your sustainability goals?
The Rosetta Stone of Intelligent Buildings
Does your organization struggle with internal projects because teams aren’t on the same page?
Let's Walk the Talk: Newcomb & Boyd's Sustainability Journey
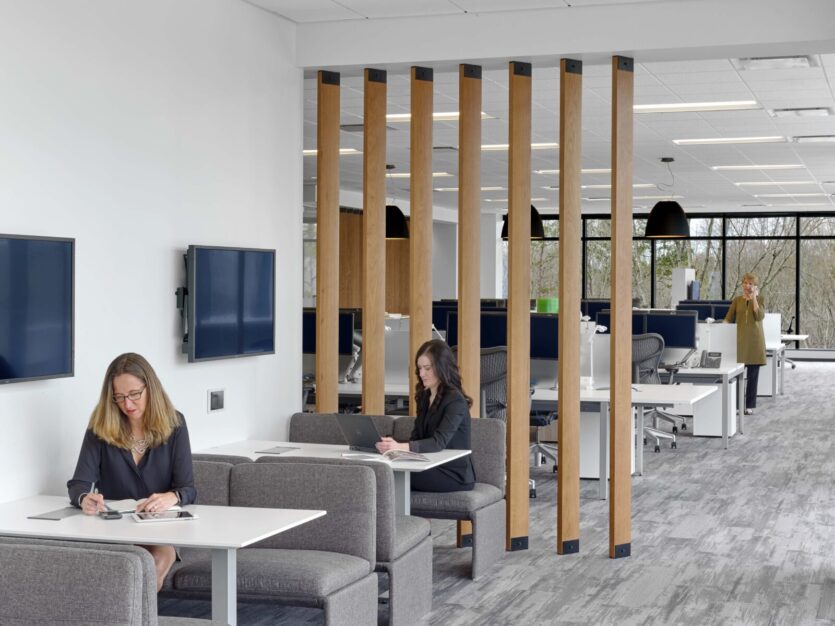
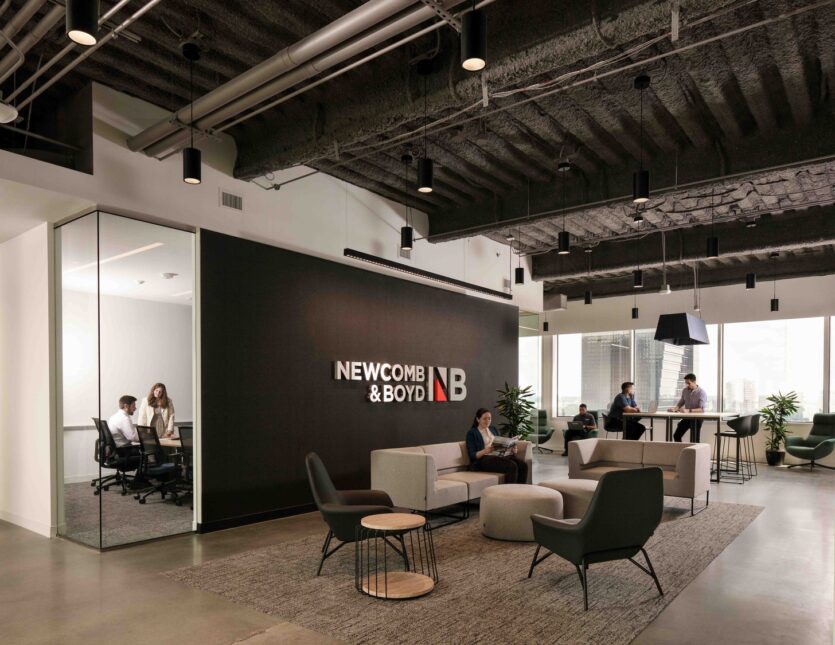
Newcomb & Boyd’s newly renovated Atlanta Office provides a space that is comfortable, healthy, and sustainable for employees and visitors. Following the company mission and values, the new office incorporates design features focused on sustainability and wellness for employees.
Taking Junction Krog District to LEED Gold
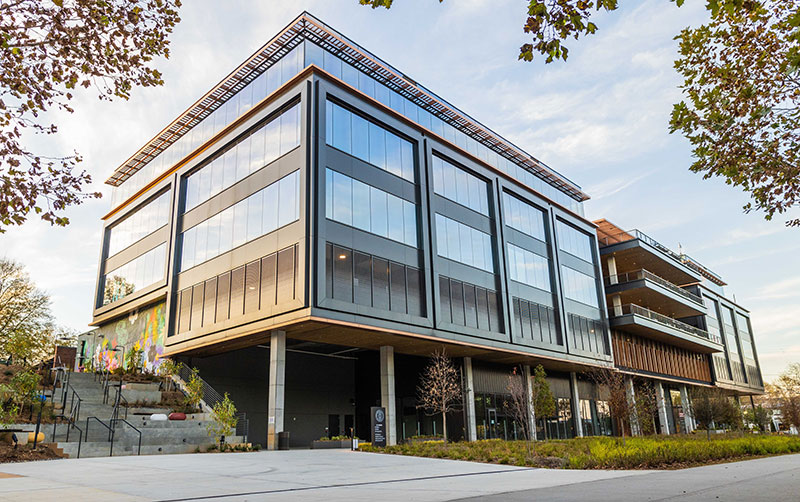
Junction Krog District initially set out to achieve LEED v4 Core and Shell certification at the Certified Level. Through our innovative pilot approaches in energy and water analyses, we gained additional points, surpassing standard documentation pathways. Without incurring any additional costs or requiring extensive design modifications, the collaborative endeavors of our team not only met but exceeded the objective, and the project achieved LEED Gold certification.
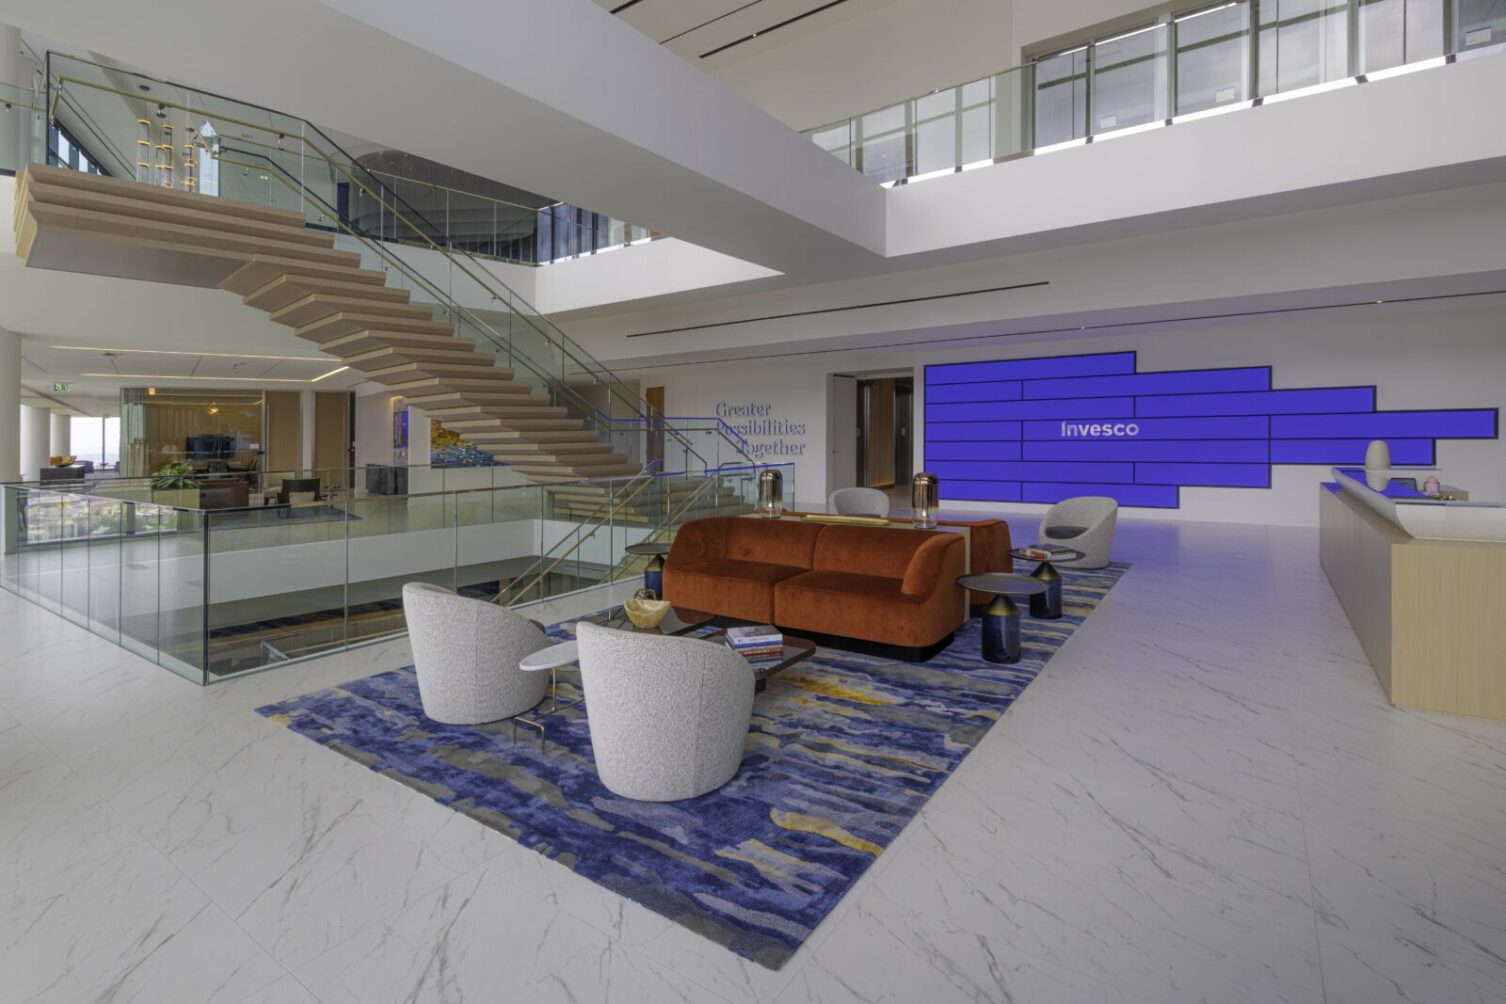
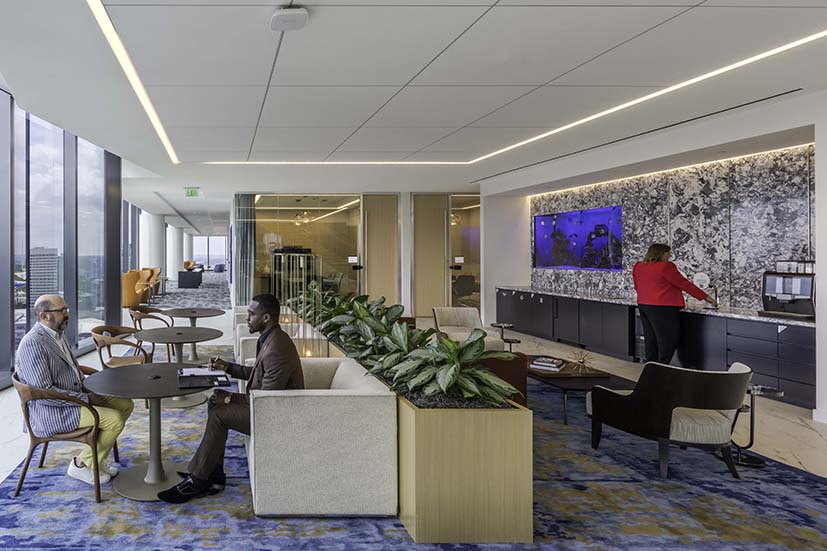
Invesco's New Headquarters: A Showcase of Innovative Design and Technology
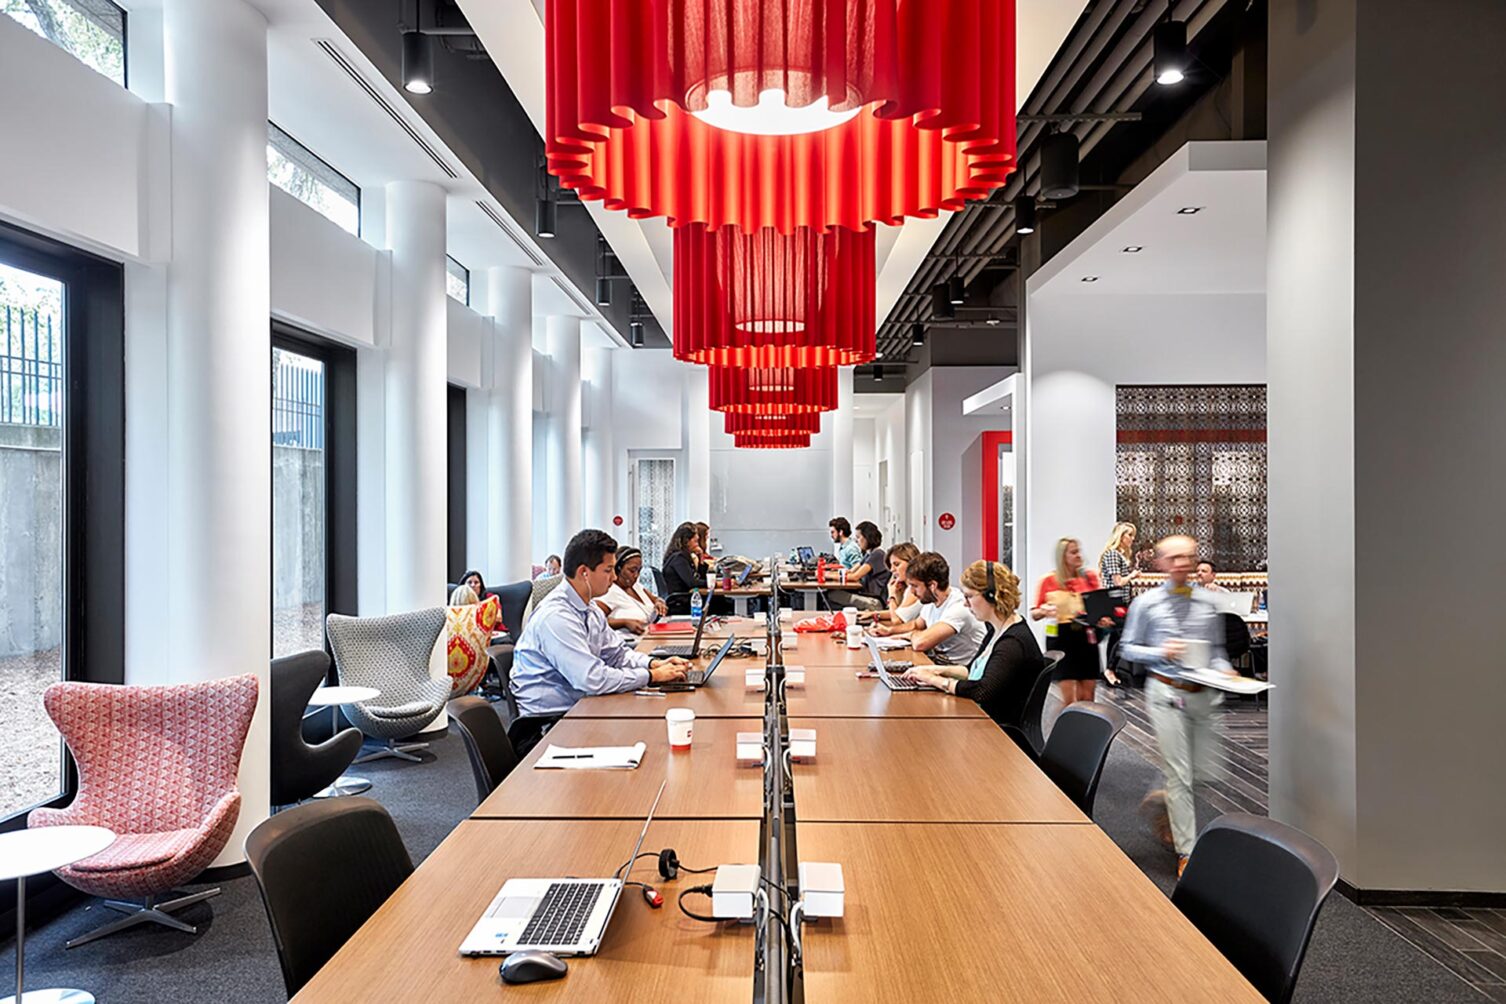
Invesco, a leading global investment management firm, has recently moved into its stunning new headquarters located in the 26-story Midtown Union development in Atlanta. This impressive space represents not just a new office, but a significant leap in design and technology, made possible by Newcomb & Boyd, which provided essential Audiovisual, Telecom, Security, Acoustics, and Specialty Lighting design services.
Cybersecurity Operational Technology Services
Our cybersecurity services offer a comprehensive approach to safeguarding your operational technologies. We enhance cybersecurity awareness through educational programs and create customized frameworks for risk management and asset security. Here’s how we can support you:
Visual Comfort: The Art and Science of Specialty Lighting Design
Did you know that our Specialty Lighting Designers prioritize your visual comfort?
It’s true! We’re dedicated to creating lighting solutions that not only illuminate your spaces but also ensure you can perform tasks comfortably and without strain.
Let’s take a closer look at how we achieve this.
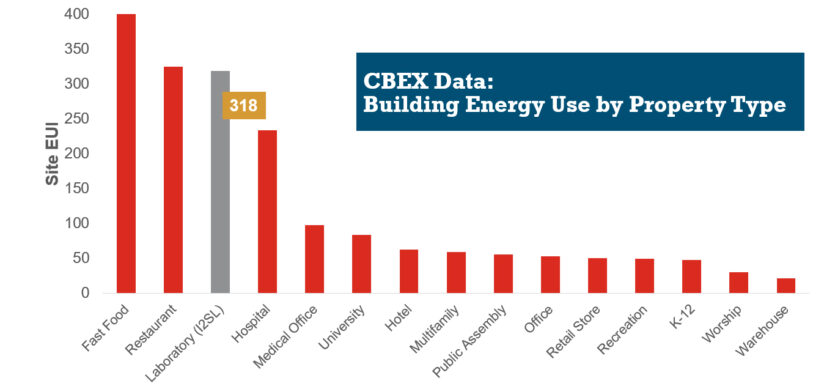
HVAC Design Approaches for Sustainable Laboratories
HVAC systems in a typical laboratory facility can use five to 10 times as much energy as the systems in a typical office building. This higher energy use is due to many factors, including 100 percent outside air systems, 24-hour-a-day operation, high internal heat gains, high air change rate requirements, equipment exhaust requirements, and high fan energy. With this significant energy use, the incentive for creative sustainable design grows—not only to create forward-thinking research spaces, but to maximize a lab’s ROI.